Geography ss2 third term
Geography ss2 third term
Geography ss2 third term
THIRD TERM: E-LEARNING NOTES
SUBJECT: GEOGRAPHY
CLASS: SS2
SCHEME OF WORK
WEEK TOPIC
THEME: MAP READING AND INTERPRETATION
- Direction and Bearing: (a) The major cardinal points, True and Magnetic North, Magnetic Variations. (b) Angular bearing and compass directions.
- Cross Section or Relief Profile: (a) Cross section drawing, (b) Vertical exaggeration, (c) Intervisibility (d) Calculating average gradient.
THEME: ECONOMIC AND HUMAN GEOGRAPHY
- Population: (a) World population: (i) Size (ii) Distribution patterns (iii) Density (iv) Structure (b) Factors affecting population distribution: (i) Climate (ii) Relief (iii) Soil (iv) Water (v) Minerals, etc.
- Settlements: (a) Types of settlements: (i) Urban (ii) Rural (b) Characteristics of urban and rural settlements: (i) Population (ii) Economy (iii) Administration etc. (c) Factors of settlement location (soil, weather, etc.).
- Settlements: (d) Settlement patterns: (i) Nuclear (ii) Dispersed (scattered) (iii) Linear (iv) Isolated (v) Conurbation (e) Factors of development of each pattern.
- Settlement Interactions: (a) Types of interactions: (i) Commercial (ii) Cultural (iii) Administrative, etc. (b) Interaction patterns: (i) Urban – Rural (ii) Urban – Urban (iii) Rural – Rural, etc.
- MID – TERM BREAK
- Geo-Political Issues: (1) Land Reclamation: (a) Meaning of land reclamation (b) Reclamation methods: (i) Afforestation (ii) Construction of barriers (iii) Sand filling (iv) Construction of drainages (v) Control of erosion, etc. (c) Importance of land reclamation.
- GIS Data: Data Sources: (i) Land surveying (ii) Remote sensing (iii) Map digitizing (iv) Map scanning (v) Field Investigation (vi) Tabular data, etc.
- Revision
- Examination
Geography ss2 third term
WEEK 1
SUBJECT: GEOGRAPHY
CLASS: SS 2 DATE: ……………………….
TOPIC: Direction and Bearing
CONTENT:
(1) The major cardinal points, True and Magnetic North, Magnetic Variations.
(2) Angular bearing and compass direction.
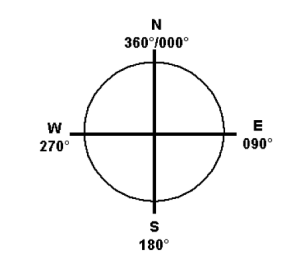
SUB-TOPIC 1: THE MAJOR CARDINAL POINTS
The major cardinal points are four. They are North, South, East and West. They are usually referred to as four-cardinal points.
Four cardinal points
There are other intermediate points of the compass based upon and named from cardinal points. They are eight-cardinal points and sixteen-cardinal points. All are used to locate direction of a place on the earth.
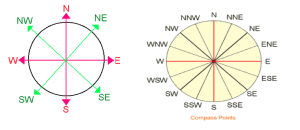
Eight-cardinal points Sixteen-cardinal points
TRUE AND MAGNETIC NORTH
True north (geodetic north) is the direction along the earth’s surface towards the geographic North Pole while “Magnetic north” is the direction that your compass tells you is north. The compass, because it has a magnetic needle, does not point to true north. The north point it shows is known as magnetic north.
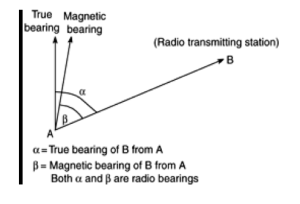
Magnetic Variation: This is the angle of difference between the true north and magnetic north. It is also known as magnetic declination and it varies from year to year.
Geography ss2 third term
EVALUATION:
- Explain cardinal points.
- Discuss the following: (i) true north (ii) magnetic north (iii) magnetic variation
SUB-TOPIC 2: ANGULAR BEARING AND COMPASS DIRECTION
DIRECTION: The direction of a place can be shown in two ways. These are compass point and angular bearing.
COMPASS POINTS: This is the use of four cardinal points, which include North, South, East and West. For a better accuracy in the measurement of direction, the eight cardinal points must be used.
PROCEDURES IN MEASURING DIRECTION
- Locate the two places involved on the map.
- Place your cardinal points at the place you are to determine the direction.
iii. Join the two locations together with your ruler.
- Determine the direction of your point on your cardinal points.
Example: What is the direction of town X from Y?
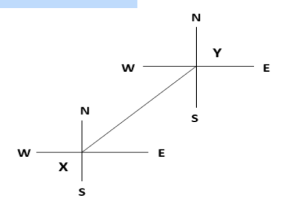
From the above diagram, the direction of town Χ from Ύ is south-west.
EVALUATION:
From the above diagram, what is the direction of town Y from X?
BEARING: This refers to the direction of one place from another. It is expressed in degrees and it is determine with the use of protractor measured from North in clockwise direction.
METHODS OF MEASURING BEARING
- Locate the two places given in the map.
- 2. Place your cardinal points at the place you are to determine the location
- 3. Join the two places together with your ruler
- 4. Place your protractor on the side of the line and the degree which falls on the line represents the bearing
For example, the bearing of town Χ from Ύ, from the above diagram is 1250
EVALUATION:
- Find the direction of the principal office from your classroom.
- What is the bearing of your football field from your classroom?
Geography ss2 third term
GENERAL EVALUATION
- Highlight the procedures for measuring the bearing of a place.
- Use Map Reading for West Africa by D.A. Nimako, Map 5 Freetown to answer the following questions.
- Find the direction of GODERICH from MURRAY TOWN.
- What is the bearing of MURRAY TOWN from GODERICH?
WEEKEND ASSIGNMENT
Use the same map above to find the (i) bearing of Lakka Isolation Hospital from CONGO TOWN (ii) direction of Lakka Isolation Hospital from CONGO TOWN.
READING ASSIGNMENT
Read Essential Geography for SSS by O.A Iwena. Pages 324 – 326.
REFERENCE TEXTS:
- Map Reading for West Africa by D. A Nimako.
- Essential Geography for SSS by O.A Iwena
Geography ss2 third term
WEEK 2
SUBJECT: GEOGRAPHY
CLASS: SS 2 DATE: ………………….
TOPIC: Cross Section or Relief Profile
CONTENT:
- Cross section drawing
- Vertical exaggeration
- Intervisibility
- Calculating average gradient.
SUB – TOPIC 1: CROSS SECTION OR RELIEF PROFILE
It is defined as the practice whereby relief shown by contours on map are drawn to bring out the real appearance of such relief as it is on the ground. In other words, it helps us to visualise the appearance of the landform or relief as seen from the ground at a glance.
PROCEDURES FOR CROSS SECTION DRAWING
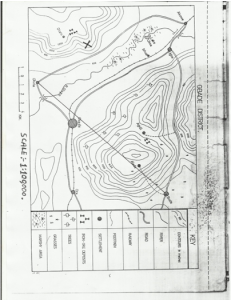
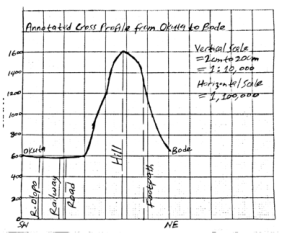
To draw a cross – section between two points on a map, (for example, between Okuta and Bode settlements as shown in the diagram below) certain steps have to be taken.
- Draw a section line to join the two points i.e. Okuta and Bode settlements on the map.
- Examine the heights of the two points and the heights of the contours along the line, noting in particular the highest and lowest points, the vertical interval and the contour form.
- Get a straight edge of a strip of paper.
- Place the straight edge of the piece of paper on the map along the line of section (Okuta and Bode).
- Mark the heights of Okuta and Bode settlements on the paper.
- Make a mark on the paper where each contour line is crossed and note the height of the contour. It is
important also to mark on the paper such features as roads, rivers, lakes, valley, settlements etc. This is
known as annotation.
- Choose suitable vertical scale (e.g. 1cm to 50m/100m or 1cm to 50ft/100ft as shown on the contour interval). Graduate your graph paper accordingly starting from zero (0) on the vertical ‘Y’ axis.
- From point zero (0) on the graph paper, draw a horizontal line equal in length to the line between the two points (i.e. Okuta and Bode) on the map.
- Place the straight edge of the paper with the markings from the map along the base line or horizontal line on the graph paper. On the graph paper, mark out the corresponding heights from the map at the exert vertical distance from the base line.
- Finally, draw a line from Okuta to Bode to join up the various heights between the two points and the relief profile is completed.
Geography ss2 third term
VERTICAL EXAGGERATION
There is always vertical exaggeration in a drawn cross – section because the vertical scale of the cross
section of an area is always larger than the horizontal scale of the map. On the vertical scale, the height is
usually magnified a number of times over and above that of the horizontal scale. Vertical exaggeration is therefore the number of times vertical heights are exaggerated or enlarge in relation to horizontal distances.
In calculating the vertical exaggeration of the scale, the following have to be done:
- Convert the vertical scale into a representative fraction or a ratio.
- Write down the horizontal scale of the map also as a ratio
- Divide the horizontal scale by the vertical scale to give the vertical exaggeration in whole number and
decimal form.
For example, calculate the vertical exaggeration of the above figure
Horizontal scale 100,000
Vertical exaggeration = ———————- = ———- = 10 times
Vertical scale 10,000
INTERVISIBILITY
It is a way of knowing whether one point or place on the map can be seen from another point or place on the same map within the limits of physical sight. Cross section drawing can help to know if two points on a map are intervisible or not. The most important factor to know whether two points are intervisible is to look whether high contour lines exist between the two points. The presence of higher contour lines simply shows that the two points are not visible to each other and vice versa.
For example, in the diagram above, Bode is not visible from Okuta due to the presence of highland.
CALCULATING AVERAGE GRADIENT
Gradient is the steepness of slope. The gradient of a slope is the slope of the ground expressed as a ratio between the height and length of the ground.
Step to follow in finding the gradient between two points on a map:
- Know the heights of the two places, and find out the difference in height between the two places (i.e. the
vertical interval)
- Calculate the horizontal distance between the two points. This must be in the same unit of measurement as the difference in the height that you determined earlier.
- Place the height difference all over the horizontal distance.
For example, calculate the gradient of the road from Ogba to Bode in the map extract above.
Geography ss2 third term
Calculation of gradient of the road from Ogba to Bode
-Horizontal distance/equivalent (H.D or H.E = Length of the road) = 11.9cm (± 0.2 = 11.7cm – 12.1cm)
-Vertical Interval (V.I= Height difference between Bode and Ogba/Contour difference between
Bode and Ogba) = 650m – 600m = 50m
– Map scale 1:100,000
– H.D/H.E or Length of the road in km = 11.9 x 100,000
100,000
= 11.9km (11.7km – 12.1km)
– Convert the length to metres = 11.9 x 1,000m = 11,900m
– Substitute the variables into the formular below:
Gradient = Vertical Interval or V.I
Horizontal Distance/Equivalent H.D/H.E
= 50m
11,900m
= 1/238
WEEKEND ASSIGNMENT
- Study the MODEL EXAM. MAP EXTRACT D of Comprehensive Certificate GEOGRAPHY for Senior Secondary Schools (Physical, Human and Regional Geography with Map Reading) by O. AREOLA et al on a scale of 1:50,000 and answer the following questions:
(a) Draw an annotated cross profile along line X-Y.
(b) Are Points X and Y intervisible? Give one reason for your answer.
(c) Calculate the gradient between line X-Y.
READING ASSIGMENT
Read the world population
REFERENCE TEXTS:
- Map Reading for West Africa by D.A. Nimako.
- A Practical Approach to Map-Reading for West Africa (fourth edition) by C.A. Aso
- Essential Geography for Senior Secondary Schools by O.A Iwena.
WEEK 3
SUBJECT: GEOGRAPHY
CLASS: SS 2 DATE: ………………..
TOPIC: POPULATION
CONTENT
- World population
- Factors affecting population distribution
SUB-TOPIC 1:
MEANING OF POPULATION
Population can be seen as the total number of people living in a given geographical area. Population can also be seen as the number of people living in an area at a particular time. Population is dynamic as a result of birth rate and death rate.
The population of the world is currently estimated at more than 4.5 billion people and has the average growth rate of 2.3%. Over the years the world has grown from a mere 1.5 billion in 1900 to 4.5 billion in 1980 and by the year 2000 it is expected to have raised up to 6.3 billion people.
In terms of continents, Asia is the most populous continent in the world, followed by Europe, Africa, North America, South America and Australia is the least. In terms of countries, China is the most populous country (1.3 billion), followed by India (1.0 billion), United States (276,261 million), Indonesia (219,267 million) etc.
In Africa, Nigeria is the most populous country, and in the world the seventh populous country with 117, 328 million people. These population estimates for these countries by the year 2000.
POPULATION CONCEPTS:
- Over Population: This is a situation where the population is more than the available resources in a country
- Under Population: This is the situation where the population is less than available resources of country. This means that, the size of population is so small that when combined with available resources of a country and given the level of existing technology, it will secure minimum return per head.
- Optimum population: This is when the population of a given country can be supported by the available resources in that particular country, so as to achieve the highest possible standard of living.
- Population Density: This is defined as the number of persons per unit area of land or per square kilometer. It is usually expressed mathematically as seen below.
- Birth Rate: Birth rate (Natality) of a country refers to the rate at which children are being given birth to in a country. Generally, high birth rate may lead to population increase or over population; while low birth rate can lead to low population.
- Death Rate: The death or mortality rate of a country refers to the rate at which people (both adult and children) die in a country. Generally, high death rate leads to population decrease or low population. While low death rate leads to increase in population.
EVALUATION
- What is population?
- Highlight 5 population concepts.
- Outline sequentially the first three most populous counties of the world and the most populous country in Africa.
SUB-TOPIC 2: POPULATION DISTRIBUTION PATTERN
Population is not evenly distributed throughout the world. Some areas are densely populated while some are moderately populated and others are sparsely populated. Factors which may influence the distribution of world population include soil, relief, mineral resources, commercial activities, industrial activities, pressure of social amenities. Pattern of world population is grouped into three:
- The very densely populated areas
- The moderately populated areas and
- The very sparsely populated parts of the world. This is represented in a tabular form:DENSELY POPULATED PARTS OF THE WORLD
Geography ss2 third term
If you need all the content at an affordable price (N500) ONLY, feel free to contact us.
+2348039740135 : whatsapp
Are you a school owner or a teacher,
Click the image below to join Teachers’ Connect to learn more…

YOUR COMMENTS ARE WELCOME